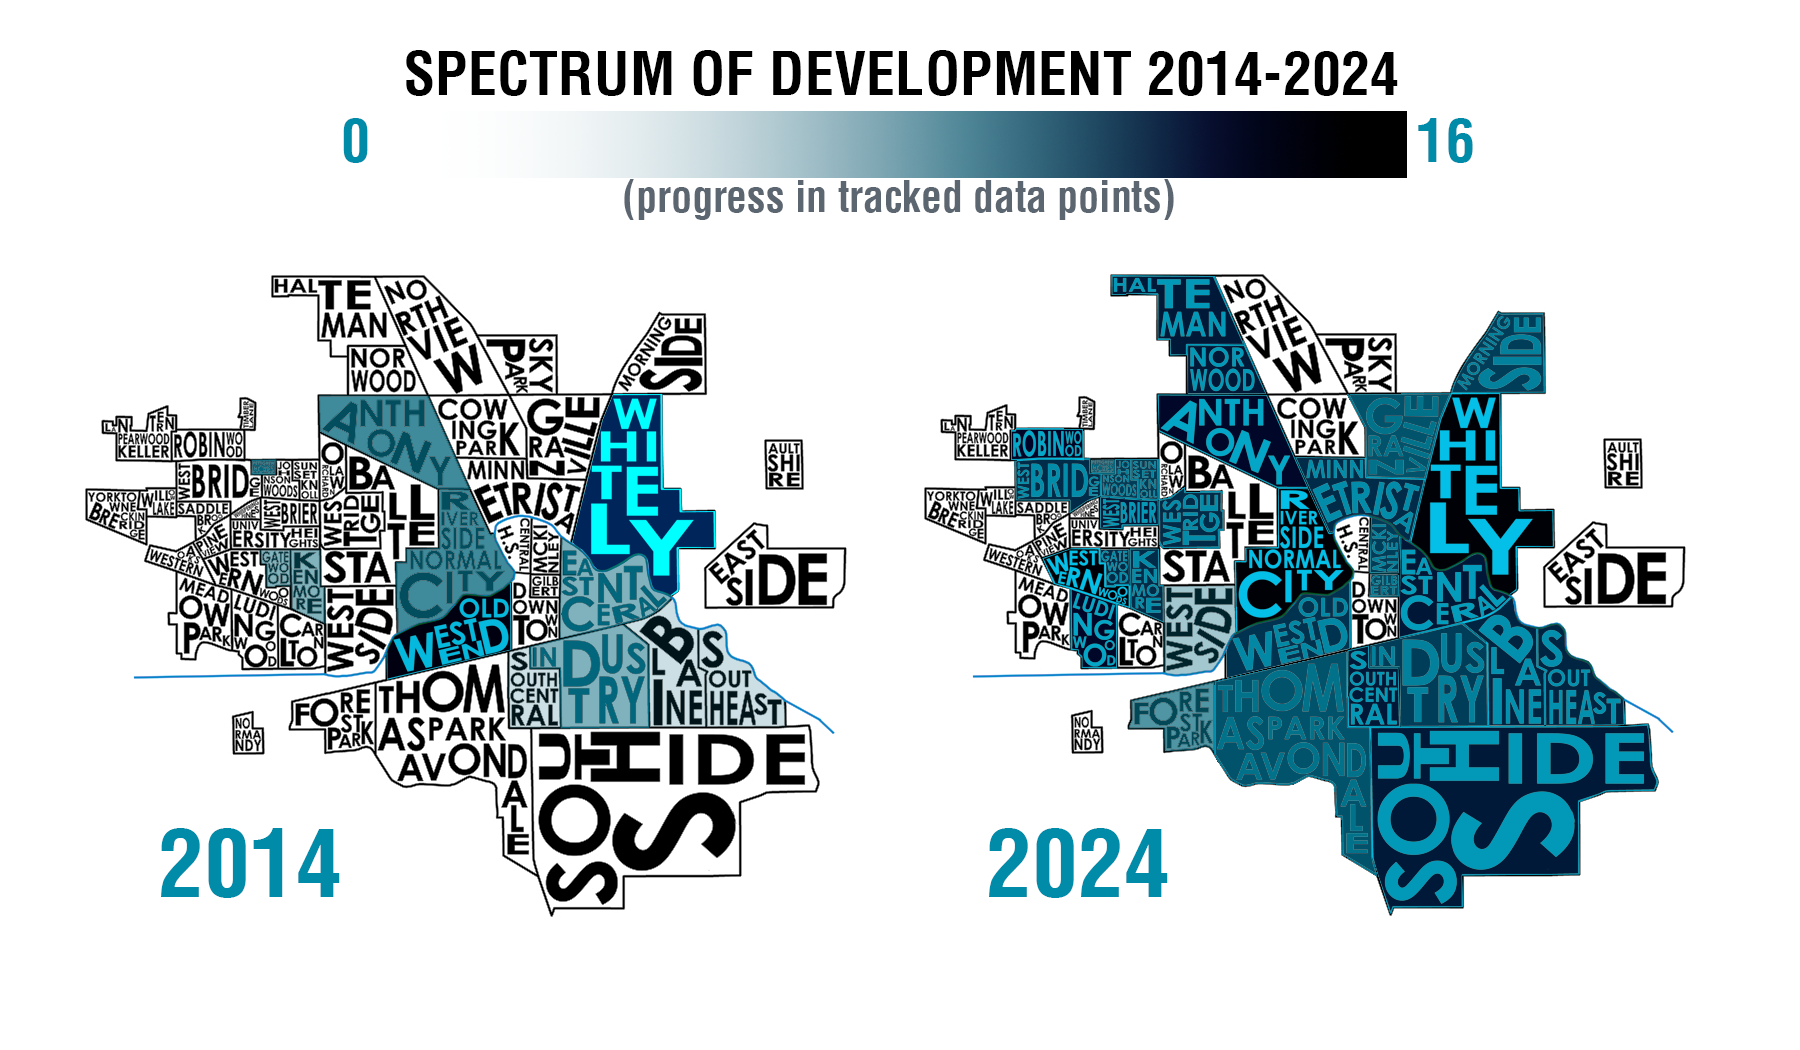
In 2018 over half of Muncie’s neighborhoods were active, with 27 out of 52 meeting regularly. This graphic shows the progression and level of activity in each neighborhood since we began tracking in 2014.
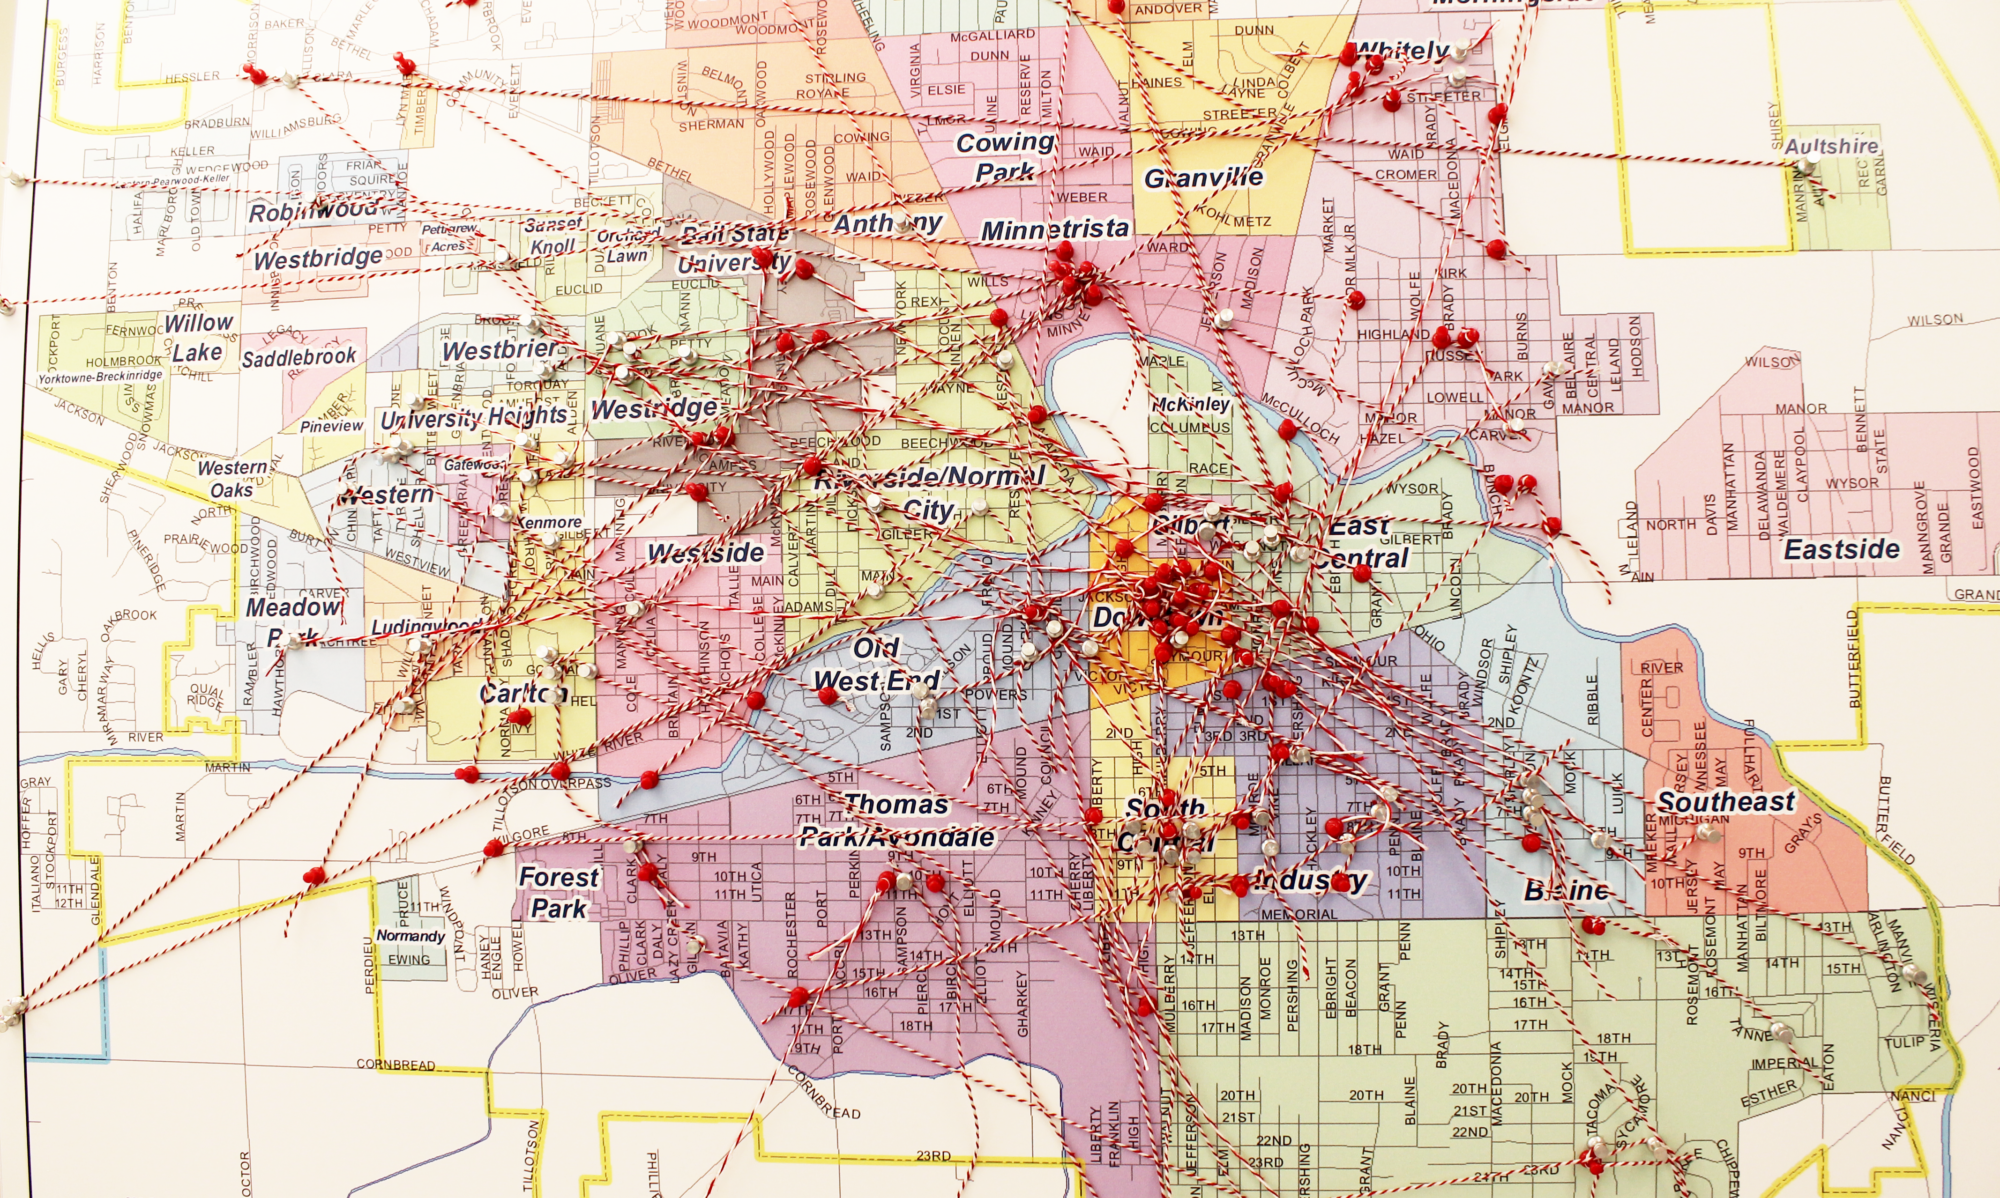
Connecting Muncie Neighborhood partners and resources