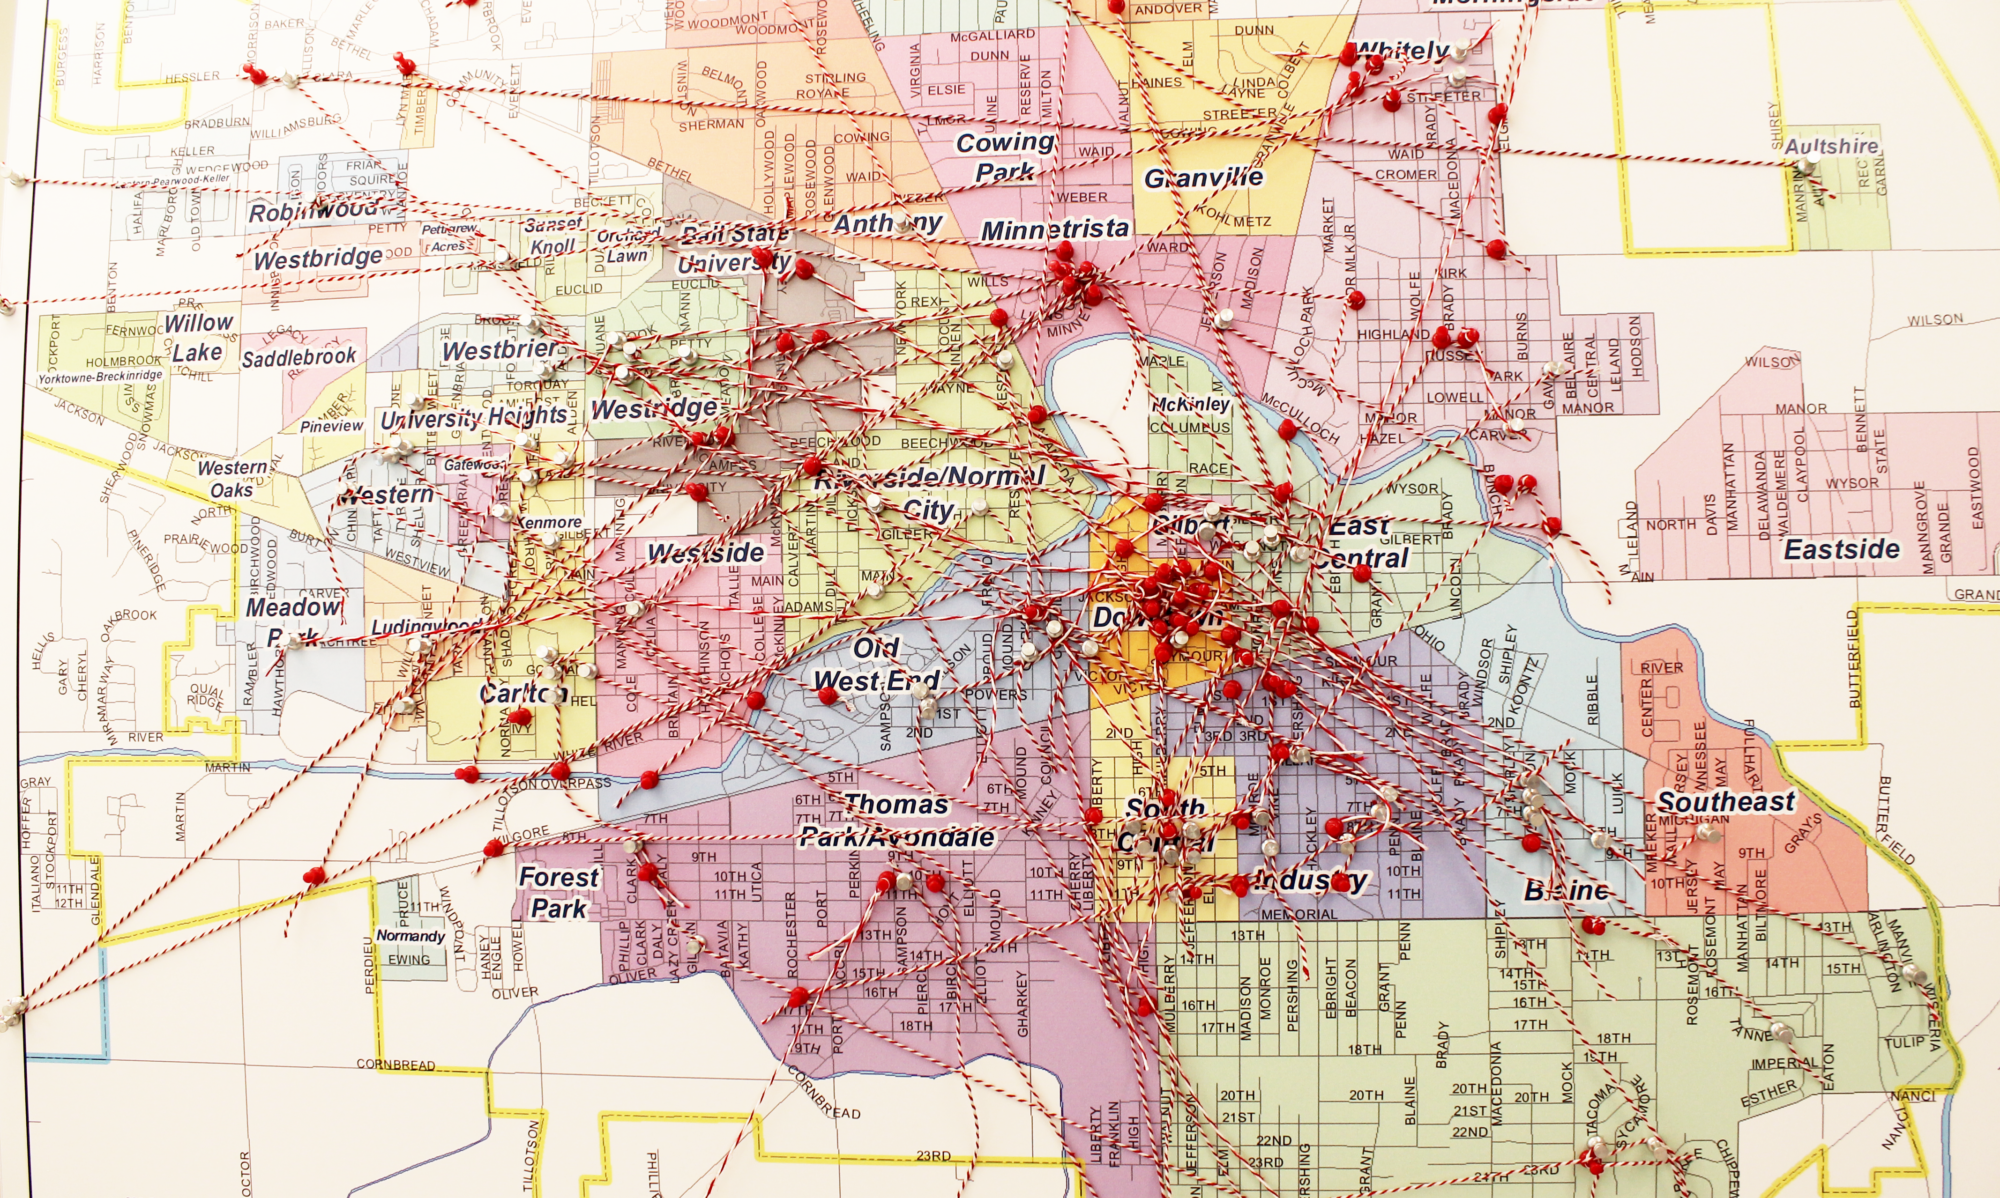
The goal of this project was to map the quality-of-life for Muncie neighborhoods, and specifically to map the living quality for the Anthony-Northside neighborhood using GIS and remote sensing techniques. Four general categories of living quality indicators were evaluated for each house in the neighborhood and fifteen maps were created in this project: one map for Home Insulation; two maps for Home value and Lot size; one map for Lot Greenness, ten maps for its adjacency to community amenities, and one Overall Living Quality Index map.
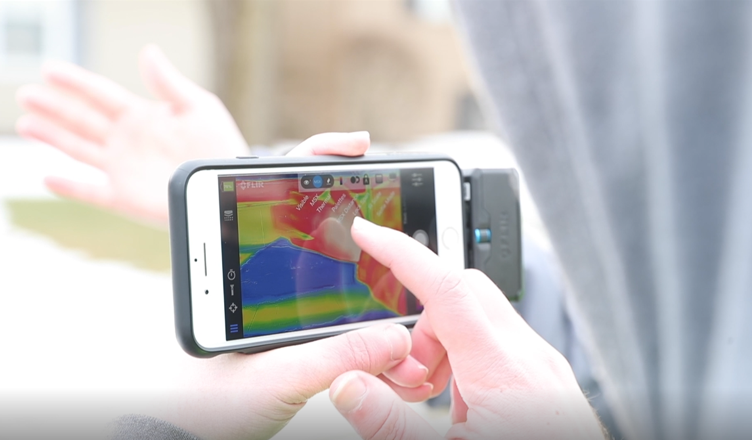
Home Insulation for each house was evaluated from a thermal infrared image collected by students using a FLIR One thermal camera. Home value and lot size were obtained from Zillow.com. Lot Greenness was assessed based the greenness percentage in each lot, which was derived from the USA NAIP NDVI (Normalized Difference Vegetation Index) imagery. Proximity to community amenities including Clinics, Schools, Libraries, Restaurants, USPS Mailboxes, Bus Stops, Parks, Bike Trails, Recreations, and Fire Stations were analyzed using Network Analysis in ArcGIS Pro and ArcGIS Online. The values of all indicators were scaled to categories of 1 to 5, with 1 being the lowest living quality and 5 being the highest. The Overall Living Quality Index was obtained by averaging all fourteen living quality indicators.
Explore some of the story maps created using the collected data.
Image Gallery
Faculty Mentor: Jason Yang
Department: Geography
Community Partner: Muncie Action Plan, Anthony-Northside Neighborhood Association
Course: Advance Remote Sensing – GEOG 437